---
title: "If It Feels Hard to Read, It Probably Is"
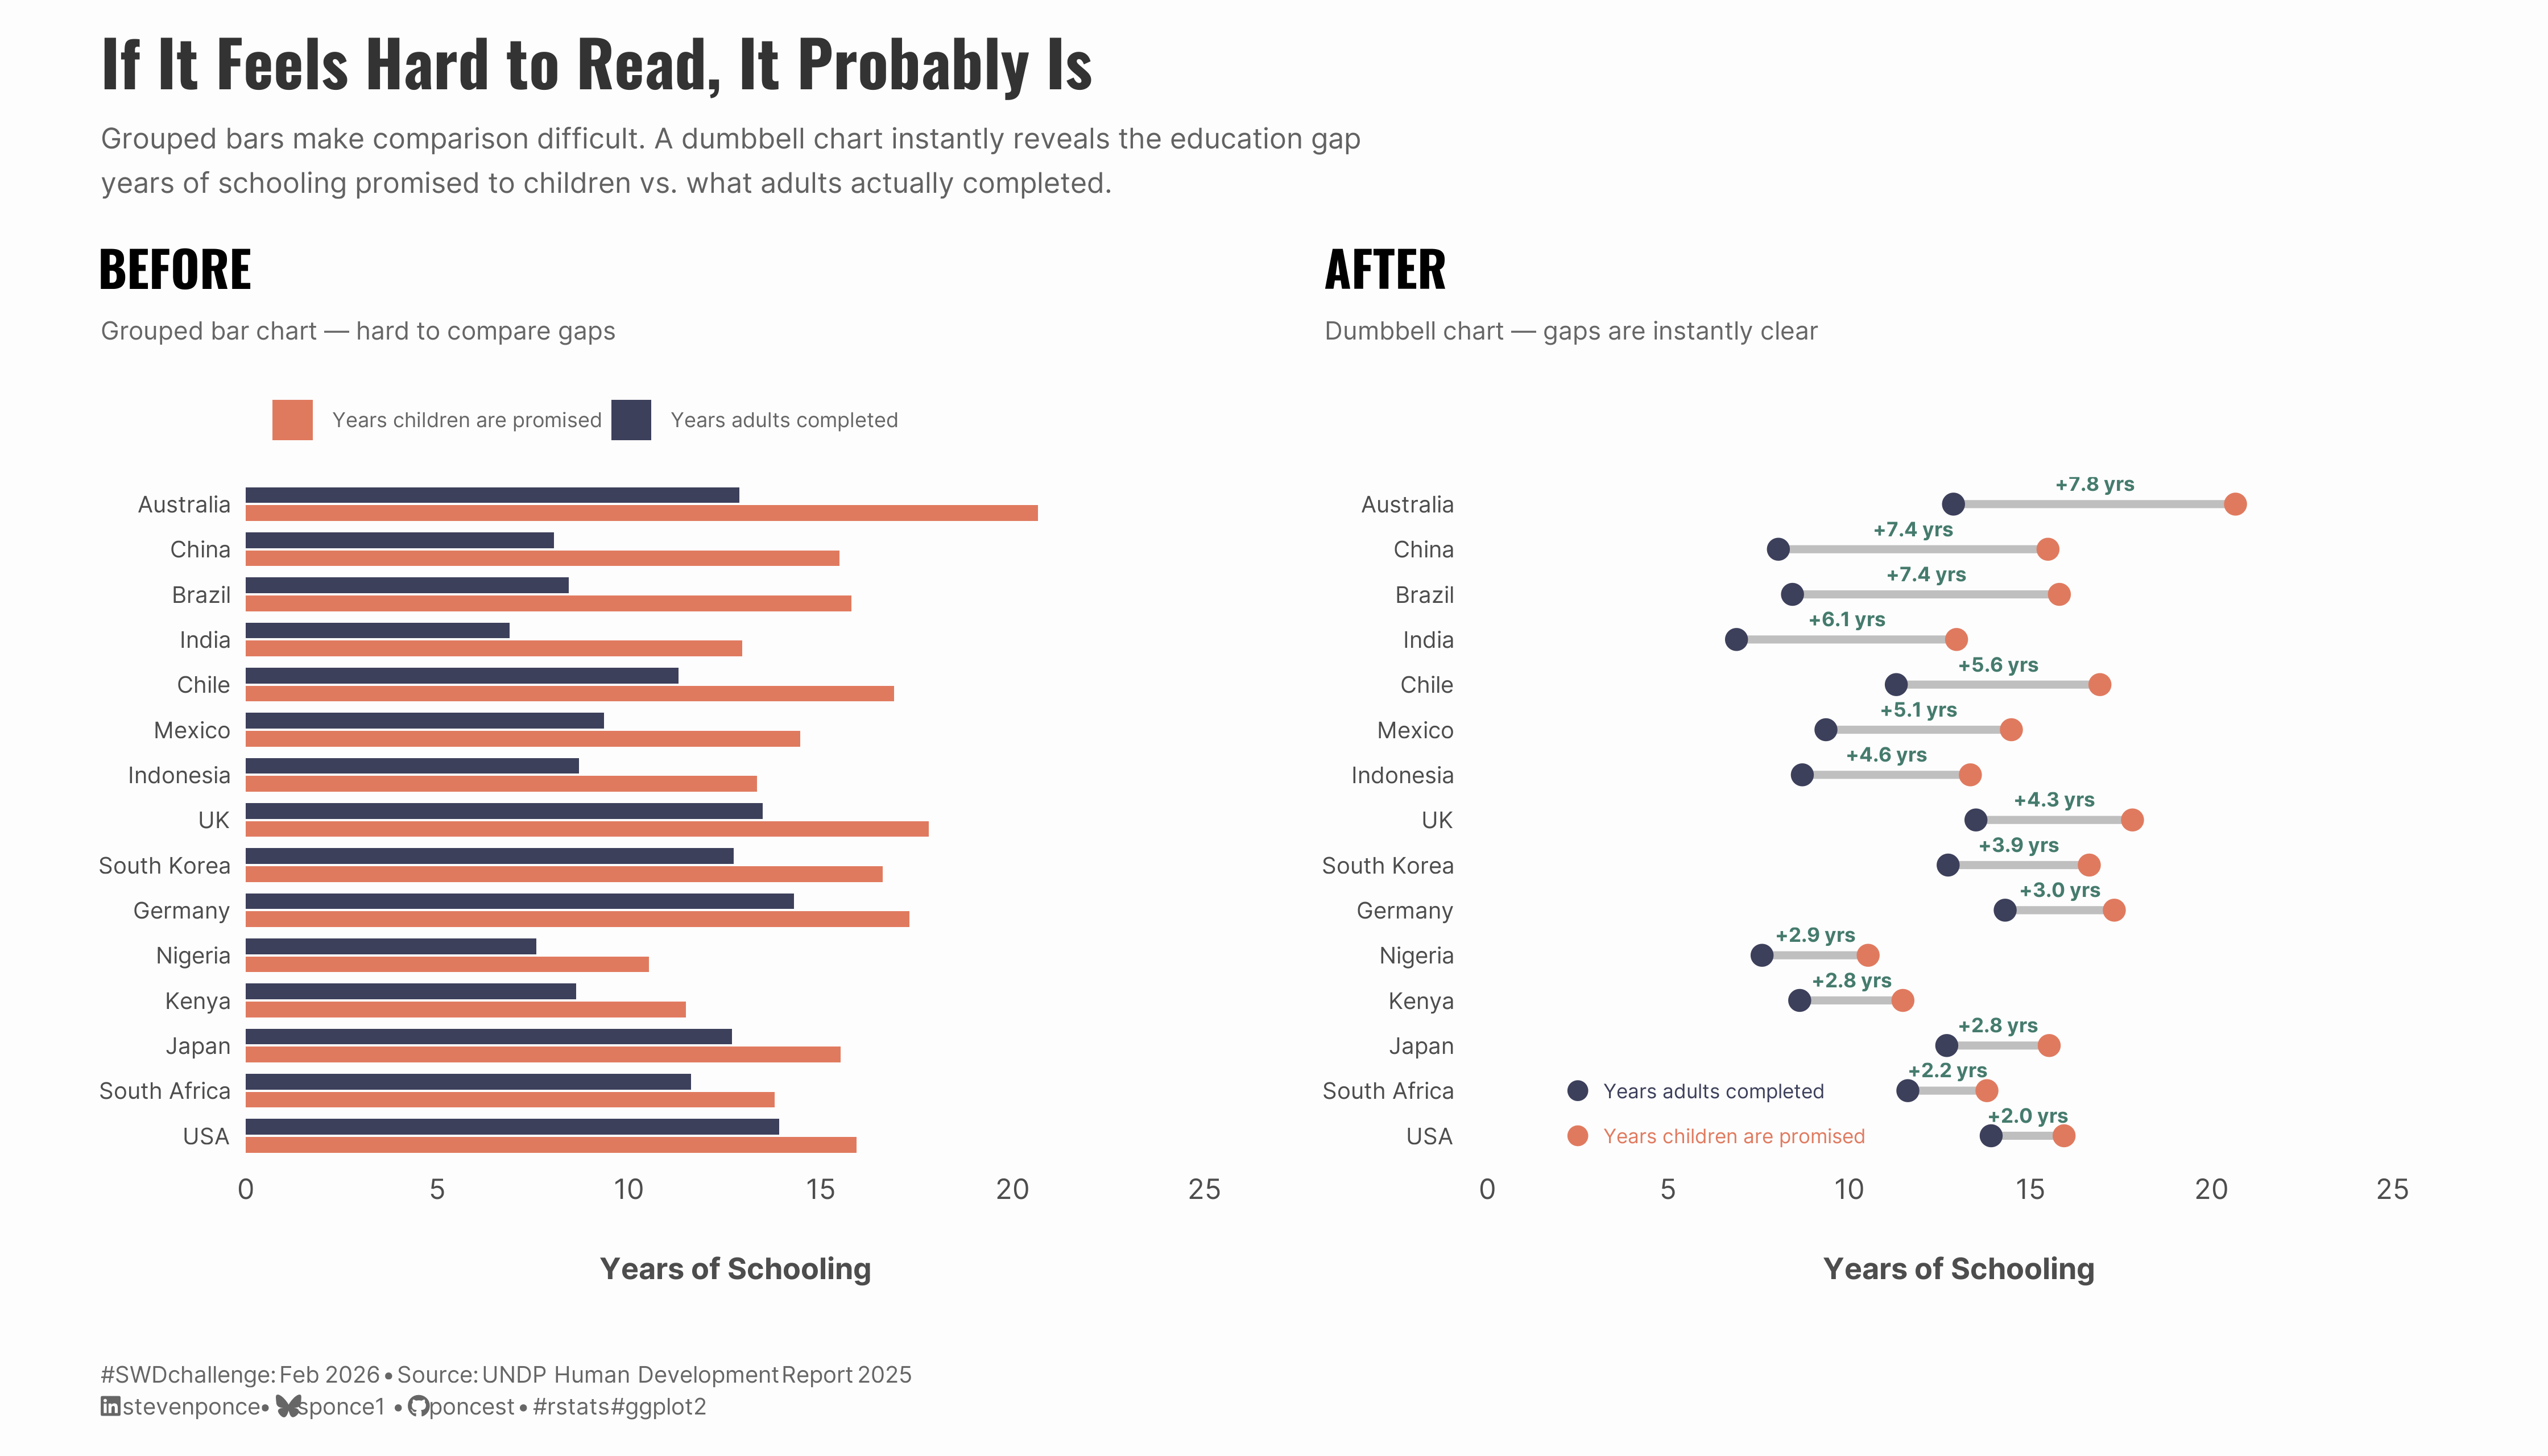
subtitle: "Grouped bars make comparison difficult. A dumbbell chart instantly reveals the education gap -- years of schooling promised to children vs. what adults actually completed."
description: "A before-and-after visualization demonstrating the SWD lesson 'Trust Your Instincts' from Chapter 5 of storytelling with data: before & after. When comparing paired values across many categories, grouped bar charts create visual clutter. Switching to a dumbbell chart makes the education gap between expected and actual years of schooling instantly clear."
author: "Steven Ponce"
date: "2026-02-01"
categories: ["SWDchallenge", "2026"]
tags: [
"dumbbell-chart",
"connected-dot-plot",
"grouped-bar-chart",
"before-after",
"education-data",
"UNDP",
"ggplot2",
"patchwork",
"chart-makeover"
]
image: "thumbnails/swd_2026_02.png"
format:
html:
toc: true
toc-depth: 5
code-link: true
code-fold: true
code-tools: true
code-summary: "Show code"
editor_options:
chunk_output_type: inline
execute:
freeze: true
cache: true
error: false
message: false
warning: false
eval: true
---
### Challenge
This month's challenge invites you to share your favorite SWD-inspired tip or lesson and bring it to life through a visual. Create something new or highlight an SWD example that illustrates it well.
Additional information can be found [HERE](https://community.storytellingwithdata.com/challenges/feb-2026-share-your-favorite-swd-tip)
### Visualization
{#fig-1}
### <mark> **Steps to Create this Graphic** </mark>
#### 1. Load Packages & Setup
```{r}
#| label: load

if (!require("pacman")) install.packages("pacman")
pacman::p_load(
tidyverse, ggtext, showtext, janitor,
  scales, glue, readxl, patchwork
)

### |- figure size ----
camcorder::gg_record(
  dir    = here::here("temp_plots"),
  device = "png",
  width  = 14,
  height = 8,
  units  = "in",
  dpi    = 320
)

# Source utility functions
suppressMessages(source(here::here("R/utils/fonts.R")))
source(here::here("R/utils/social_icons.R"))
source(here::here("R/utils/image_utils.R"))
source(here::here("R/themes/base_theme.R"))
```
#### 2. Read in the Data
```{r}
#| label: read

hdi_url   <- "https://hdr.undp.org/sites/default/files/2025_HDR/HDR25_Statistical_Annex_HDI_Table.xlsx"
temp_file <- tempfile(fileext = ".xlsx")
download.file(hdi_url, temp_file, mode = "wb")

hdi_raw <- read_excel(temp_file, skip = 5) |>
  clean_names()

### |- Data Source ----
# Primary Source: UNDP Human Development Report 2025
# URL: https://hdr.undp.org/sites/default/files/2025_HDR/HDR25_Statistical_Annex_HDI_Table.xlsx
# Date Accessed: February 1, 2026
# Table: Statistical Annex Table 1 - Human Development Index and components
# Variables: Expected years of schooling, Mean years of schooling
# Documentation: https://hdr.undp.org/data-center/documentation-and-downloads
```
#### 3. Examine the Data
```{r}
#| label: examine
#| include: true
#| eval: true
#| results: 'hide'
#| warning: false

glimpse(hdi_raw)
skimr::skim_without_charts(hdi_raw)
```
#### 4. Tidy Data
```{r}
#| label: tidy

education_data <- hdi_raw |>
  select(
    country,
    expected_years = years_7,
    actual_years   = years_9
  ) |>
  mutate(actual_years = as.numeric(actual_years)) |>
  filter(
    !is.na(country),
    !is.na(expected_years),
    !is.na(actual_years),
    !str_detect(country, "development$|OECD|countries$|World")
  )

selected_countries <- c(
  "Australia", "Germany", "United Kingdom", "United States", "Japan", "Korea (Republic of)",
  "Chile", "Mexico", "Brazil", "China",
  "Indonesia", "India", "South Africa",
  "Nigeria", "Kenya"
)

education_plot <- education_data |>
  filter(country %in% selected_countries) |>
  mutate(
    country = case_when(
      country == "Korea (Republic of)" ~ "South Korea",
      country == "United Kingdom" ~ "UK",
      country == "United States" ~ "USA",
      TRUE ~ country
    ),
    gap = expected_years - actual_years,
    gap_mid = (expected_years + actual_years) / 2,
    gap_lab = paste0("+", sprintf("%.1f", gap), " yrs")
  ) |>
  arrange(desc(gap)) |>
  mutate(country = factor(country, levels = rev(country)))

education_long <- education_plot |>
  select(country, expected_years, actual_years) |>
  pivot_longer(
    cols      = c(expected_years, actual_years),
    names_to  = "measure",
    values_to = "years"
  ) |>
  mutate(
    # Self-explanatory legend labels
    measure = recode(
      measure,
      expected_years = "Years children are promised",
      actual_years   = "Years adults completed"
    ),
    measure = factor(measure, levels = c("Years children are promised", "Years adults completed"))
  )
```
#### 5. Visualization Parameters
```{r}
#| label: params

### |-  plot aesthetics ----
colors <- get_theme_colors(
  palette = list(
    expected   = "#E07A5F",
    actual     = "#3D405B",
    connector  = "gray75",
    gap_text   = "#457B6D"
  )
)

### |-  titles and caption ----
title_text <- "If It Feels Hard to Read, It Probably Is"

subtitle_text <- str_glue(
  "Grouped bars make comparison difficult. A dumbbell chart instantly reveals the education gap\nyears of schooling promised to children vs. what adults actually completed."
)

caption_text <- create_swd_caption(
  year = 2026,
  month = "Feb",
  source_text = "UNDP Human Development Report 2025"
)

### |-  fonts ----
setup_fonts()
fonts <- get_font_families()

### |-  plot theme ----
# Start with base theme
base_theme <- create_base_theme(colors)

# Add weekly-specific theme elements
weekly_theme <- extend_weekly_theme(
  base_theme,
  theme(
    # Text styling
    plot.title = element_text(
      face = "bold", family = fonts$title, size = rel(1.4),
      color = colors$palette$title, margin = margin(b = 10), hjust = 0
    ),
    plot.subtitle = element_text(
      family = fonts$subtitle, lineheight = 1.2,
      color = colors$palette$subtitle, size = rel(0.9), margin = margin(b = 20), hjust = 0
    ),

    ## Grid
    panel.grid = element_blank(),
    panel.grid.major.x = element_blank(),
    panel.grid.major.y = element_blank(),
    panel.grid.minor.x = element_blank(),
    panel.grid.minor.y = element_blank(),

    # Axes
    axis.title.x =  element_text(size = rel(0.9), color = "gray30", margin = margin(t = 20)),
    axis.title.y = element_text(size = rel(0.9), color = "gray30",  margin = margin(r = 20)),
    axis.text = element_text(color = "gray30"),
    # axis.text.y = element_text(size = rel(0.95)),
    axis.ticks = element_blank(),

    # Facets
    strip.background = element_rect(fill = "gray95", color = NA),
    strip.text = element_text(
      face = "bold",
      color = "gray20",
      size = rel(1),
      margin = margin(t = 8, b = 8)
    ),
    panel.spacing = unit(2, "lines"),

    # Legend elements
    legend.position = "right",
    legend.title = element_text(
      family = fonts$subtitle,
      color = colors$palette$text, size = rel(0.8), face = "bold"
    ),
    legend.text = element_text(
      family = fonts$tsubtitle,
      color = colors$palette$text, size = rel(0.7)
    ),
    legend.margin = margin(t = 0, r = 0, b = 0, l = 10),

    # Plot margin
    plot.margin = margin(10, 20, 10, 20)
  )
)

# Set theme
theme_set(weekly_theme)
```
#### 6. Plot
```{r}
#| label: plot

### |- before plot ----
p_before <- ggplot(education_long, aes(x = country, y = years, fill = measure)) +
  # Geoms
  geom_col(position = position_dodge(width = 0.8), width = 0.7) +
  # Scales
  scale_fill_manual(
    values = c(
      "Years children are promised" = colors$palette$expected,
      "Years adults completed" = colors$palette$actual
    ),
    name = NULL
  ) +
  scale_y_continuous(
    limits = c(0, 25),
    breaks = seq(0, 25, 5),
    expand = expansion(mult = c(0, 0.02))
  ) +
  coord_flip(clip = "off") +
  # Labs
  labs(
    title = "BEFORE",
    subtitle = "Grouped bar chart — hard to compare gaps",
    x = NULL,
    y = "Years of Schooling"
  ) +
  # Theme
  theme(
    plot.subtitle = element_text(color = "gray40", size = 10),
    legend.position = "top",
    legend.justification = "left",
    legend.text = element_text(color = "gray40", size = 8),
    panel.grid.major.y = element_blank(),
    panel.grid.minor = element_blank(),
    axis.text.y = element_text(size = 9)
  )

### |- after plot ----
p_after <- ggplot(education_plot, aes(y = country)) +
  # Geoms
  geom_segment(
    aes(x = actual_years, xend = expected_years, yend = country),
    linewidth = 1.5,
    color = colors$palette$connector,
    lineend = "round"
  ) +
  geom_point(aes(x = actual_years), color = colors$palette$actual, size = 3.6) +
  geom_point(aes(x = expected_years), color = colors$palette$expected, size = 3.6) +
  geom_text(
    aes(x = gap_mid, label = gap_lab),
    color = colors$palette$gap_text,
    size = 2.8,
    family = fonts$text,
    fontface = "bold",
    vjust = -0.9
  ) +
  # Annotate
  annotate(
    "point",
    x = 2.5, y = 2,
    color = colors$palette$actual, size = 3.2
  ) +
  annotate(
    "text",
    x = 3.2, y = 2, label = "Years adults completed",
    color = colors$palette$actual, size = 2.8, hjust = 0, family = fonts$text
  ) +
  annotate(
    "point",
    x = 2.5, y = 1,
    color = colors$palette$expected, size = 3.2
  ) +
  annotate(
    "text",
    x = 3.2, y = 1, label = "Years children are promised",
    color = colors$palette$expected, size = 2.8, hjust = 0, family = fonts$text
  ) +
  # Scales
  scale_x_continuous(
    limits = c(0, 25),
    breaks = seq(0, 25, 5),
    expand = expansion(mult = c(0.02, 0.06))
  ) +
  # Labs
  labs(
    title = "AFTER",
    subtitle = "Dumbbell chart — gaps are instantly clear",
    x = "Years of Schooling",
    y = NULL
  ) +
  # Theme
  theme(
    plot.subtitle = element_text(color = "gray40", size = 10),
    panel.grid.major.y = element_blank(),
    panel.grid.minor = element_blank(),
    axis.text.y = element_text(size = 9)
  )

### |- combined plots ----
combined_plot <- (p_before | p_after) +
  plot_annotation(
    title = title_text,
    subtitle = subtitle_text,
    caption = caption_text,
    theme = theme(
      plot.title = element_text(
        size = rel(1.8),
        family = fonts$title,
        face = "bold",
        color = colors$title,
        lineheight = 1.15,
        margin = margin(t = 5, b = 5)
      ),
      plot.subtitle = element_text(
        size = rel(0.8),
        family = fonts$subtitle,
        color = alpha(colors$subtitle, 0.88),
        lineheight = 1.3,
        margin = margin(t = 5, b = 10)
      ),
      plot.caption = element_markdown(
        size = rel(0.65),
        family = fonts$subtitle,
        color = colors$caption,
        hjust = 0,
        lineheight = 1.4,
        margin = margin(t = 20, b = 5)
      ),
    )
  )
```
#### 7. Save
```{r}
#| label: save

### |-  plot image ----
save_plot_patchwork(
  combined_plot,
  type = 'swd',
  year = 2026,
  month = 02,
  width  = 14,
  height = 8,
  )
```
#### 8. Session Info
::: {.callout-tip collapse="true"}
##### Expand for Session Info
```{r, echo = FALSE}
#| eval: true
#| warning: false
sessionInfo()
```
:::
#### 9. GitHub Repository
::: {.callout-tip collapse="true"}
##### Expand for GitHub Repo
The complete code for this analysis is available in [`swd_2026_02.qmd`](https://github.com/poncest/personal-website/tree/master/data_visualizations/SWD%20Challenge/2026/swd_2026_02.qmd). For the full repository, [click here](https://github.com/poncest/personal-website/).
:::
#### 10. References
::: {.callout-tip collapse="true"}
##### Expand for References
**SWD Challenge:**
- Storytelling with Data: [Feb 2026 - share your favorite SWD tip](https://community.storytellingwithdata.com/challenges/feb-2026-share-your-favorite-swd-tip)
**Data Source:**
- United Nations Development Programme. (2025). *Human Development Report 2025: Statistical Annex Table 1 - Human Development Index and components*. Retrieved February 1, 2026, from <https://hdr.undp.org/data-center/documentation-and-downloads>
**Book Reference:**
- Knaflic, C. N., Cisneros, A., & Velez, K. (2025). *storytelling with data: before & after*. Wiley. Chapter 5: Trust Your Instincts.
:::
#### 11. Custom Functions Documentation
::: {.callout-note collapse="true"}
##### 📦 Custom Helper Functions
This analysis uses custom functions from my personal module library for efficiency and consistency across projects.
**Functions Used:**
- **`fonts.R`**: `setup_fonts()`, `get_font_families()` - Font management with showtext
- **`social_icons.R`**: `create_social_caption()` - Generates formatted social media captions
- **`image_utils.R`**: `save_plot()` - Consistent plot saving with naming conventions
- **`base_theme.R`**: `create_base_theme()`, `extend_weekly_theme()`, `get_theme_colors()` - Custom ggplot2 themes
**Why custom functions?**\
These utilities standardize theming, fonts, and output across all my data visualizations. The core analysis (data tidying and visualization logic) uses only standard tidyverse packages.
**Source Code:**\
View all custom functions → [GitHub: R/utils](https://github.com/poncest/personal-website/tree/master/R)
:::
